
If anyone else is like me, eventually when looking up a future destination you will stumble across the climate data table on Wikipedia. There is a lot of great information, but if you are planning a trip you might just want to see at a glance the temperature ranges for the months you are interested in traveling.
This script should help you scrape tables from Wikipedia
The first step is always including packages, part of what makes the R ecosystem so wonderful.
Required Packages
1 2 3 4 5 6 7 8 9 10 11 12 13 | # Scraping library("rvest") # Melting library("data.table") # Piping library("magrittr") # Manipulating library("dplyr") # Plotting library("ggplot2") # Styling library("ggthemes") |
Next up is specifying what you want to scrape, and grab the data using rvest.
1 2 3 4 5 6 7 8 9 10 11 | url <- "https://en.wikipedia.org/wiki/Phoenix,_Arizona" kept_columns <- c("Record high °F (°C)","Record low °F (°C)") webpage <- read_html(url) tbls <- html_nodes(webpage, "table") # Shows all tables tbls # Only one table should be returned # If more matched, find search term tbls[grep("Climate data",tbls,ignore.case = T)] df <- html_table(tbls[grep("Climate data",tbls,ignore.case = T)],fill = T)[[1]] |
Now that the data is in our dataframe we can set the column names. The tables don’t get read in with proper column names, but we can use the first row of data as our column names. We will have to set the first column to be measurement though.
1 2 3 | names(df) <- df[1,] names(df)[1] <- "Measurement" |
Now we get into the data manipulation part. The data first gets piped into the melt function, which esentially converts this from a wide format to long format (for lack of better words). Once melted, the melted data is piped into filter from the dplyr package. This lets us easily keep only the melted rows we need.
1 2 3 4 5 6 7 | # Keep the rows we want df <- df %>% # Convert to Long Format melt(id.vars = c("Measurement")) %>% # Keep only two measurements for each month filter(Measurement %in% kept_columns) |
Once manipulated, we can clean the data. In this case, we are just removing the extra data included in the tables (_°c), trimming the whitespace, and replacing the long hyphen with the short hyphen. The hyphen issue affects casting the character to numeric.
1 2 3 4 5 6 7 8 9 | # Removes the inline celcius value # To keep only celcius you can replace everything up to the (__°C) df$value <- gsub('(\\(.*\\))','',df$value) df$Measurement <- trimws(gsub('(\\(.*\\))','',df$Measurement)) # Replace long hyphen df$value <- gsub('−','-',df$value) # Convert to numeric df$value <- as.numeric(as.character(df$value)) |
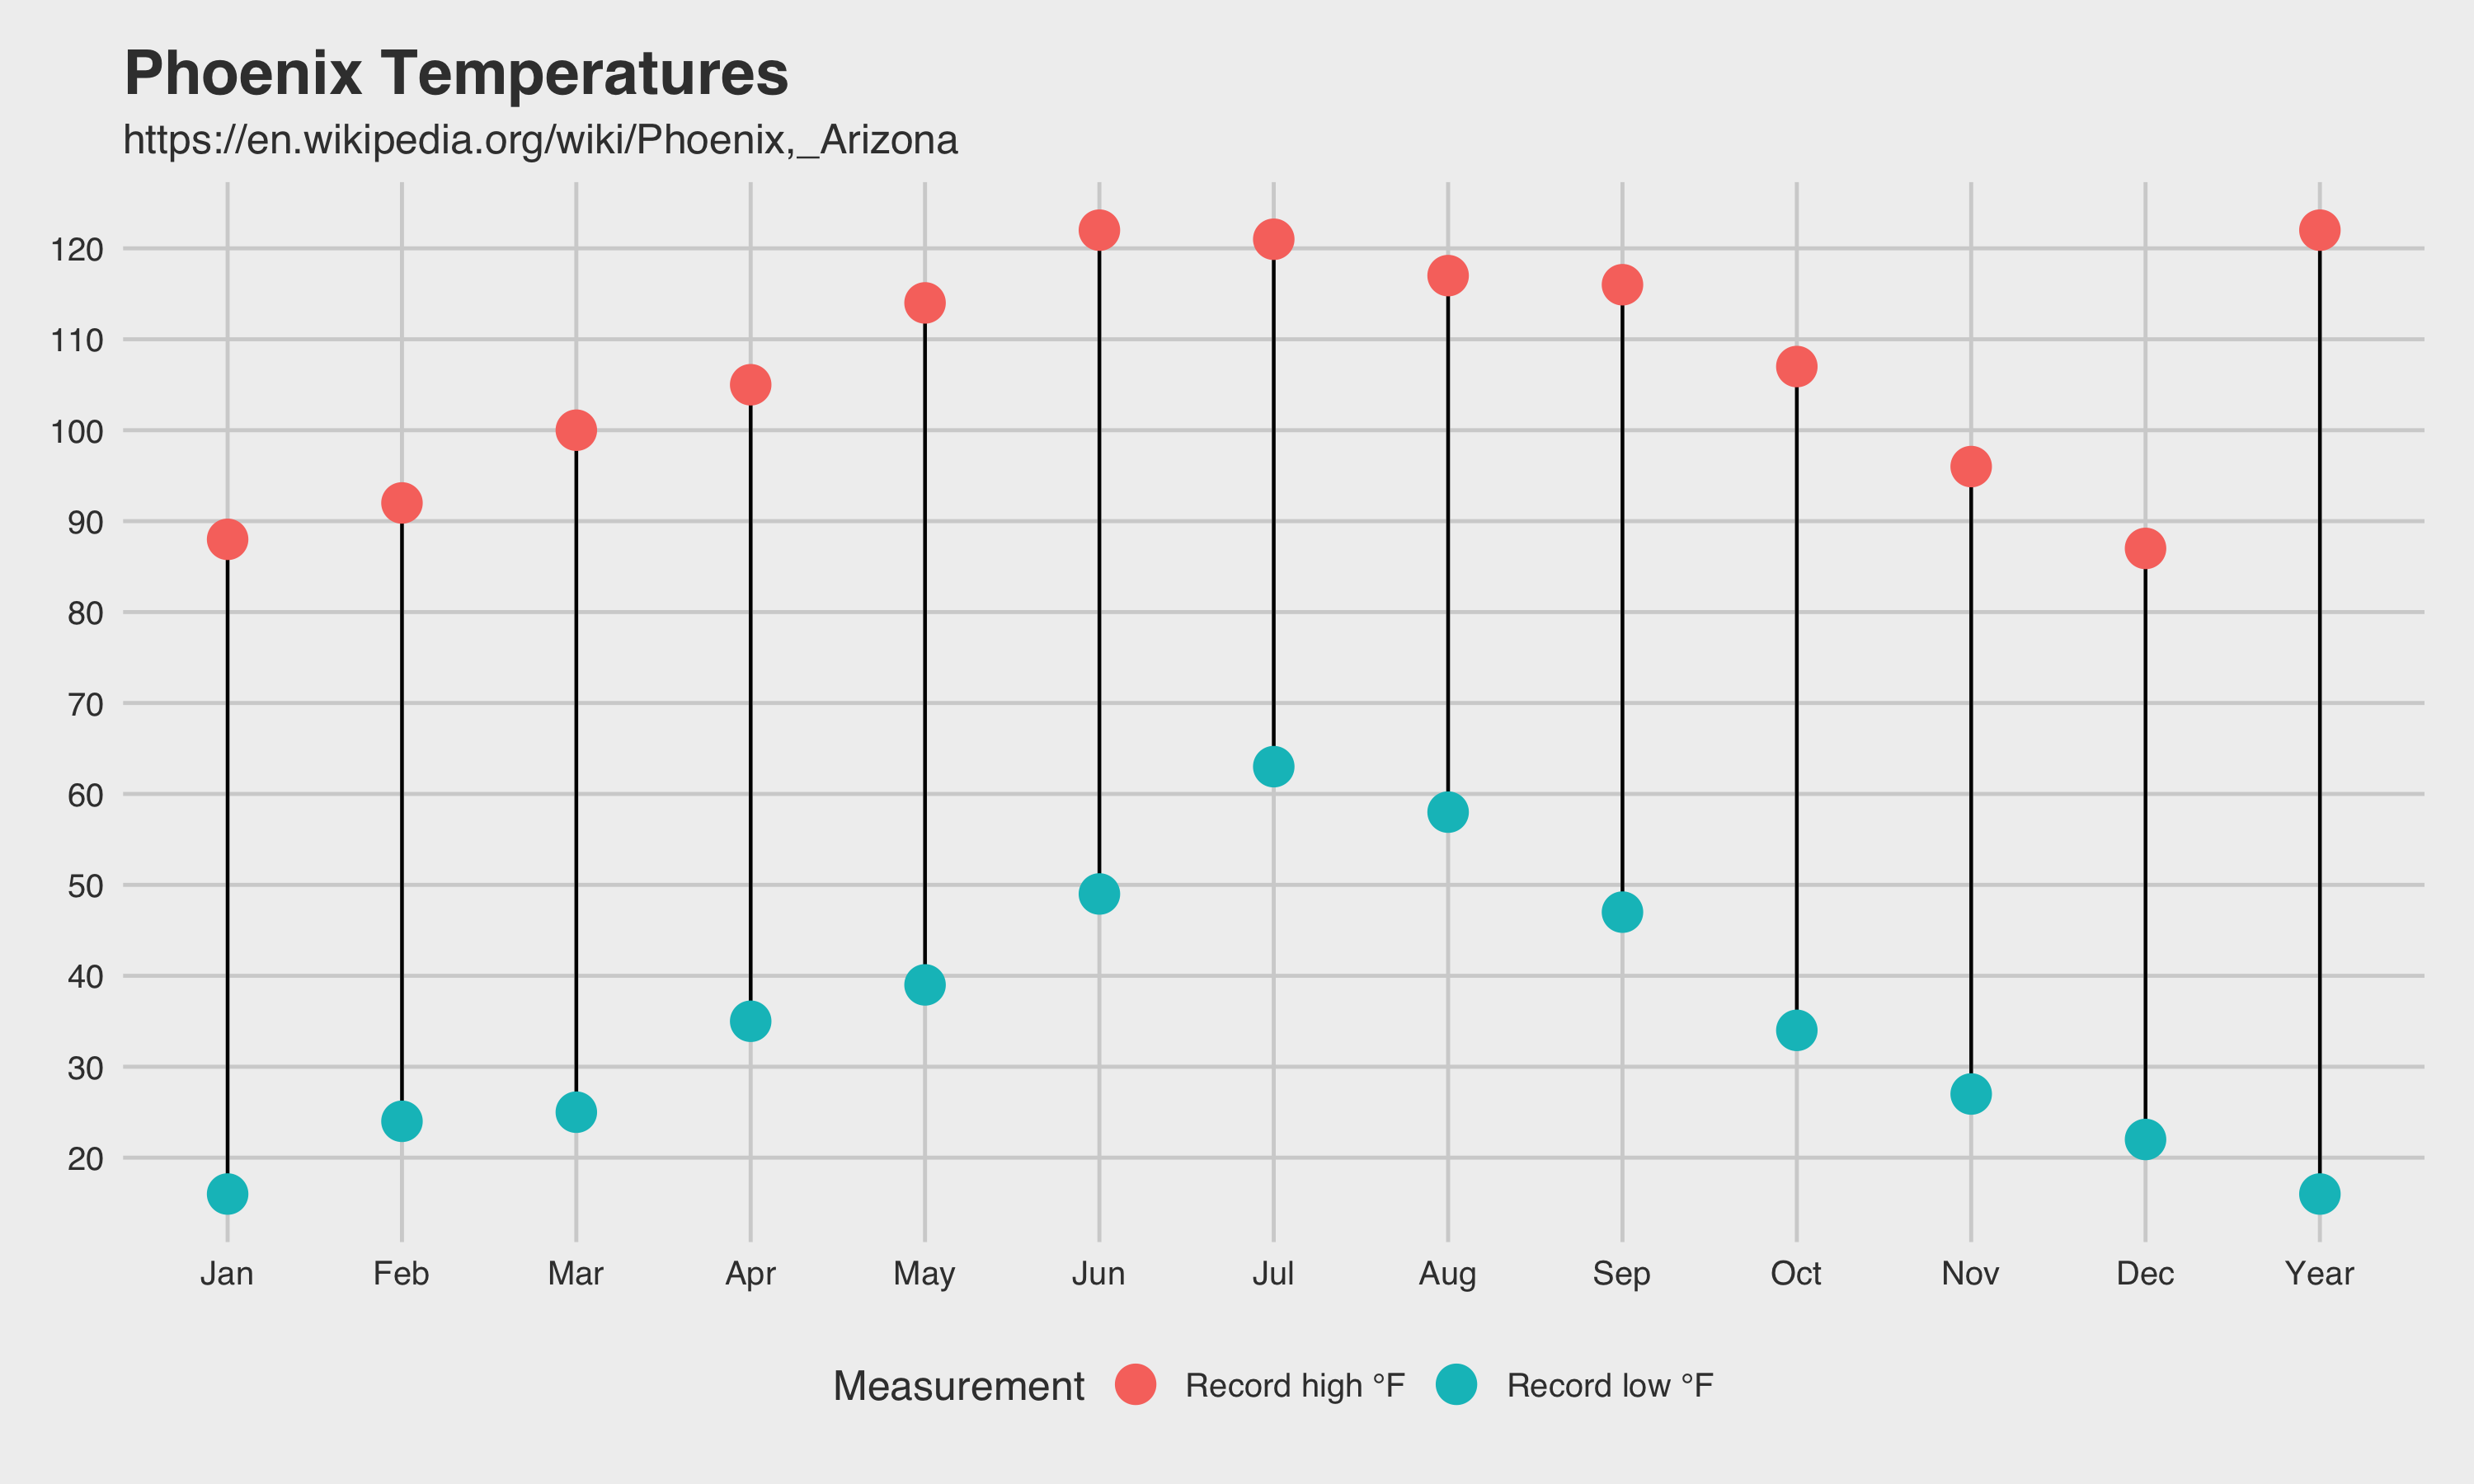
Now for the fun part
1 2 3 4 5 6 7 8 9 10 11 12 13 14 15 | p1 <- ggplot(df, aes(variable, value)) + # Plot Lines geom_line(aes(variable, value)) + # Plot circles geom_point(aes(colour = Measurement),size = 5) # Some Style p1 <- p1 + theme_fivethirtyeight() + # Trim y axis scale_y_continuous(breaks = seq(-60,130,10)) + # Labels labs(title = "Phoenix Temperatures", subtitle = url) # View the plot p1 |
1 2 3 | # Save the plot ggsave("p1.png", width = 10, height = 6, units = "in") |
Be First to Comment